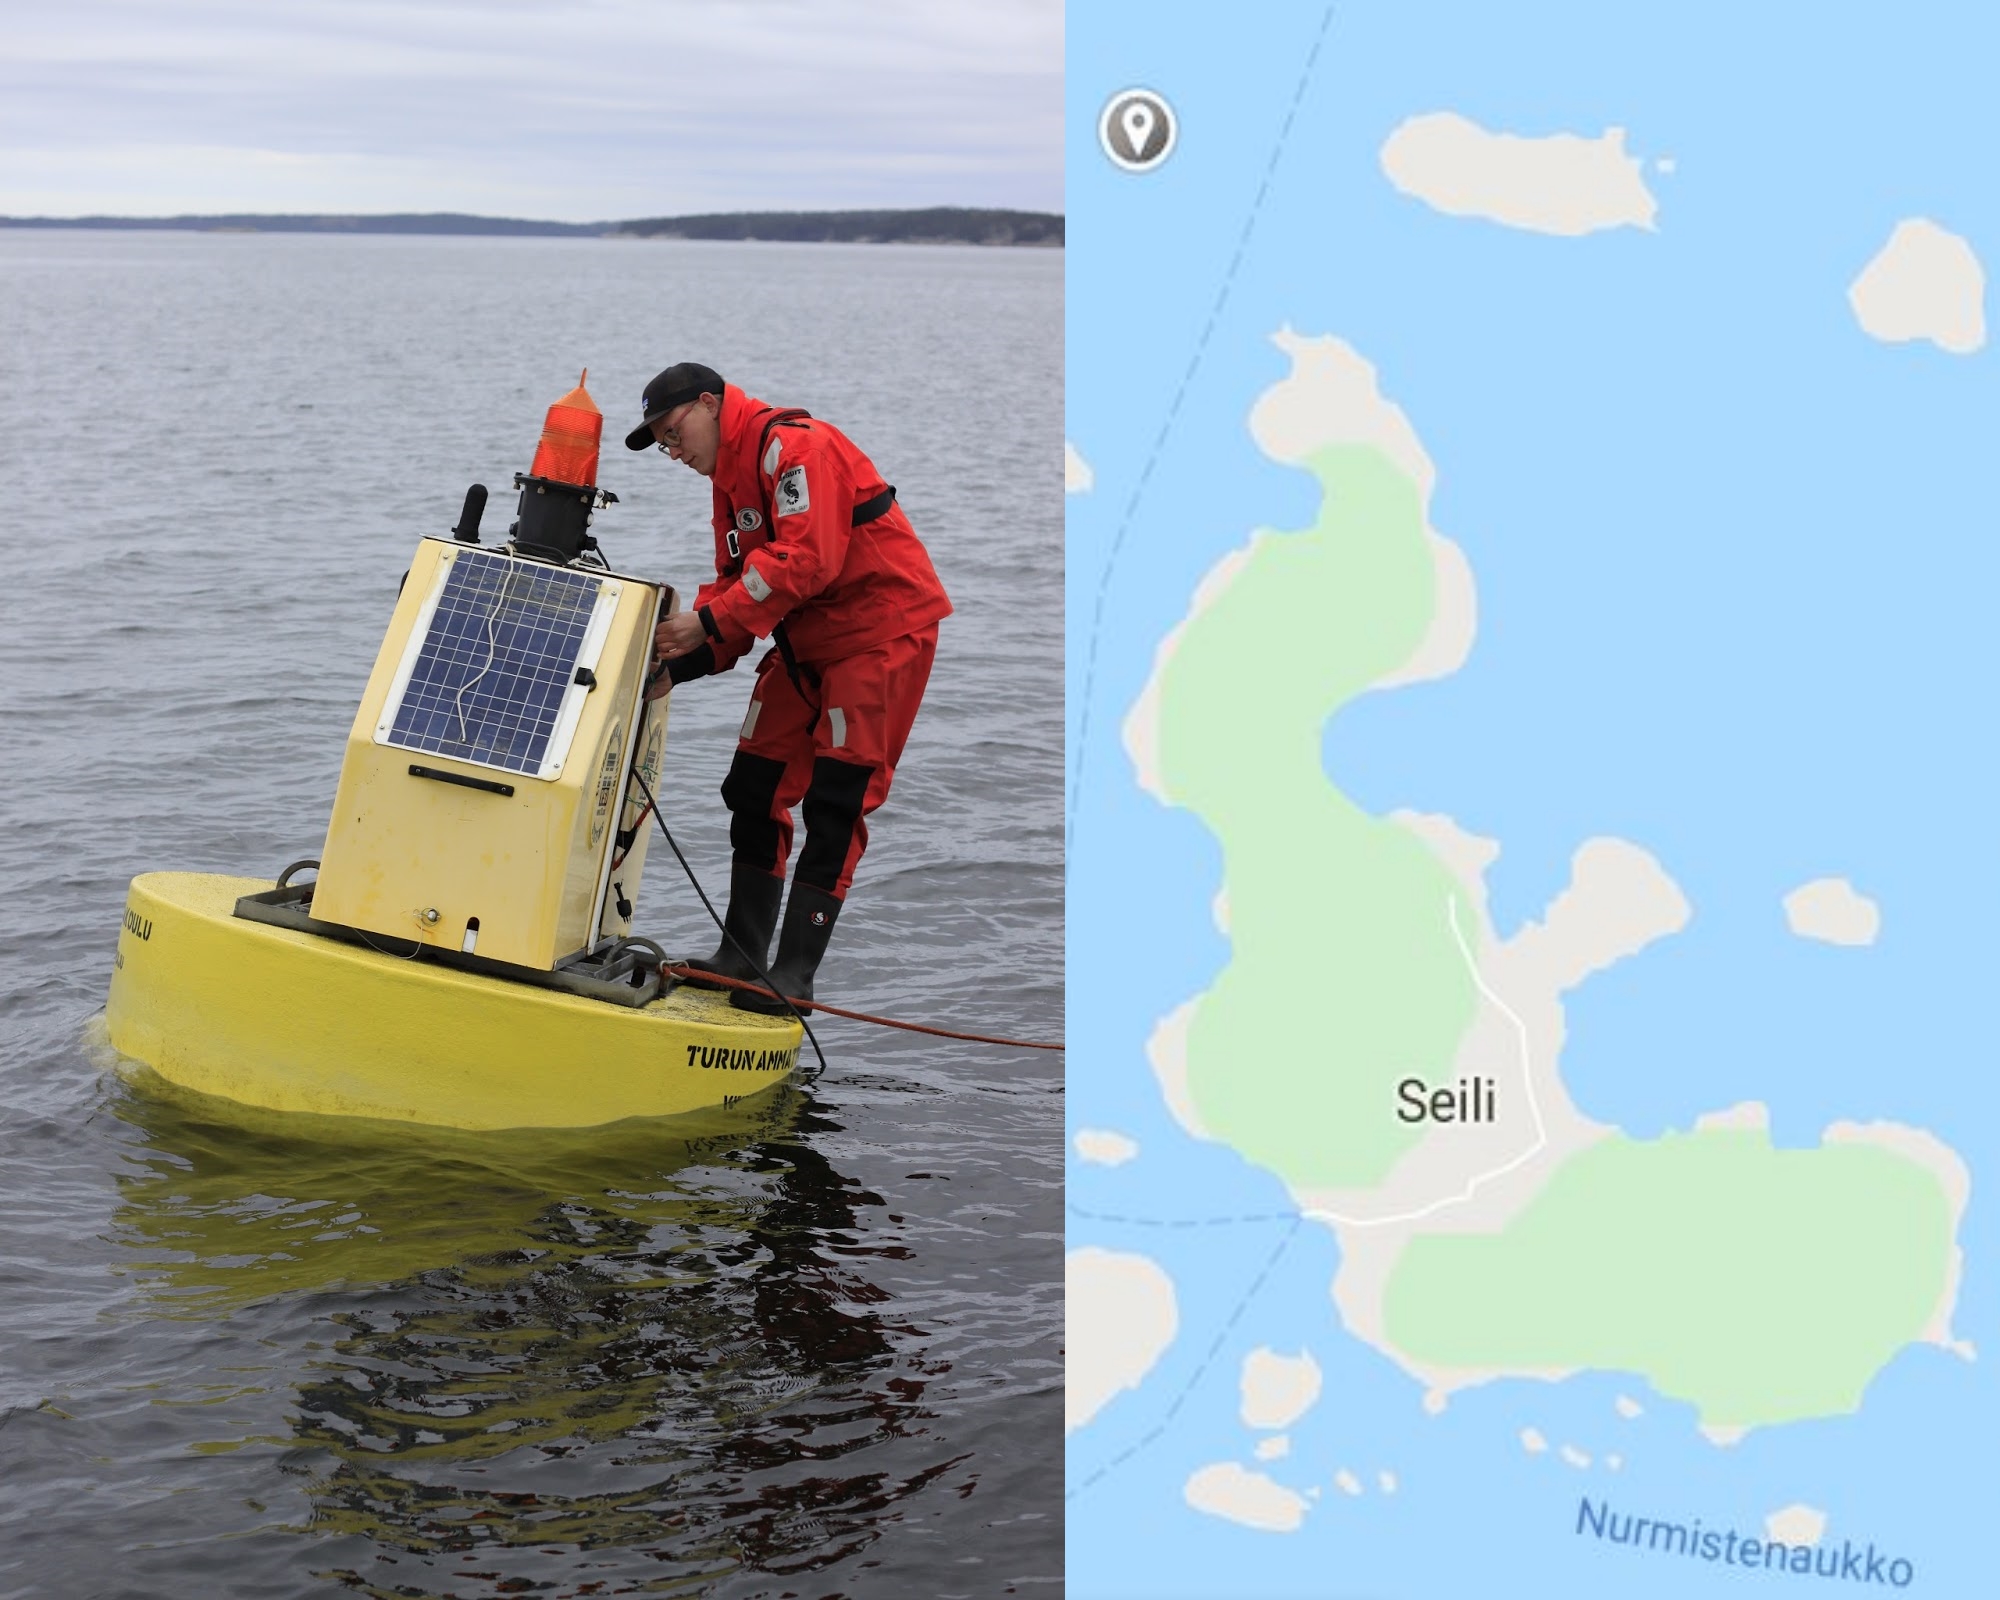
In the middle region of the Archipelago Sea, we have been operating an automated monitoring buoy since 2006. This buoy plays a crucial role in collecting detailed data on seawater quality, vertical stratification, and seasonal as well as interannual changes in the sea. Monitoring the sea is essential for comprehending its condition and holds significant value in environmental management. Long-term observations reveal trends and patterns that aid in interpreting experimental outcomes and generating new research hypotheses.
Our monitoring station consists of a YSI 6952 buoy base and a multiparameter sonde YSI 6000. The sonde measures various parameters, including salinity, temperature, dissolved oxygen, turbidity, chlorophyll-α, and blue-green algae content. The station conducts four depth measuring profiles daily, with the winch lowering the measuring device at one-meter intervals. These measurements cover a depth range from 40 meters down to 2 meters below the surface. The station operates from spring, as soon as the ice permits, until early winter before the ice forms. In 2015, we expanded our capabilities by adding a weather station to the buoy, measuring air temperature, pressure, humidity, precipitation, wind speed, and direction.
Note! The current new sea buoy was deployed in spring 2024. However, visualization of the 2024 data was not initiated until February 2025, so the visualization presented for 2025 and 2026 is based on recorded, unverified data. Due to calibrations and installation work carried out after the buoy was deployed, the 2024 graph is distorted at its beginning. The buoy was taken out of service for winter storage on 27 November 2025, and measurements will resume in spring 2026.
Here, data from 2011 are provided as graphs. These graphs are interactive, allowing you to scale, zoom and save them. Additionally, you have the option to download specifc data sections as CSV files. These dynamic graph visualizations have been created by University of Turku, Research IT.
The monitoring program is a collaborative effort between the Turku University of Applied Sciences, the Archipelago Research Institute of the University of Turku, the Finnish Meteorological Institute (FMI), and other valuable partners within the FINMARI consortium.
Select the year from which the graphs will be displayed.
Temperature [°C]: This parameter tracks the sea water temperature from the surface to a depth of 40 meters. The temperature typically begins to rise in May, marking the onset of thermal stratification. By late summer, thermal stratification reaches its peak, with surface temperatures exceeding 20 °C while deeper waters remain around 6-7 °C. The layer where water temperature experiences a rapid drop, known as the thermocline, separates the warmer mixed surface water from the cooler deep water below. As autumn progresses, surface waters gradually cool, and the thermocline eventually dissipates. Autumn storms and convection then mix the entire water column.
Salinity [‰]: This parameter measures sea water salinity in parts per thousand (‰). In the Archipelago Sea, salinity typically falls within the range of 5.7 to 6.2‰. Higher salinity indicates denser water, causing the saltier water to sink to the bottom of the water column. In the Baltic Sea, both a vertical salinity gradient and a temperature gradient are observed within the water column. Deeper areas feature a transition layer where salinity undergoes rapid changes, known as a halocline, typically found at depths of around 60-80 meters. However, in the Archipelago Sea, the halocline is very weak or nonexistent.
Oxygen [mg/L]: This parameter measures the dissolved oxygen content in the water column. Dissolved oxygen concentrations are subject to seasonal changes. Cold water has a higher capacity to hold dissolved oxygen compared to warm water, resulting in higher oxygen content during colder periods. In summer, thermal stratification can lead to lower oxygen concentrations near the bottom. Additionally, warmer temperatures accelerate the photosynthetic rate of phytoplankton, leading to elevated oxygen levels at the surface, particularly during phytoplankton blooms in April-May and late summer.
Chlorophyll-a [ug/L]: This parameter reflects the biomass of microscopic algae in the water column. Planktonic algae depend on sunlight for photosynthesis, resulting in higher abundance in the surface layer. The peak chlorophyll concentrations occur during phytoplankton blooms.
BGA [cells/mL]: This parameter measures the concentration of Blue-Green Algae (cyanobacteria) in the water column. Like other algae, BGA also rely on sunlight for photosynthesis. Their concentration peaks in late summer and can increase significantly during calm wind conditions, leading to very high densities.
Turbidity [NTU]: This parameter measures the clarity of seawater and the presence of materials that make the water appear turbid. Typically, turbidity increases as you move deeper into the water column. Contributing factors to turbidity include clay, silt, finely divided inorganic and organic matter, algae, soluble colored organic compounds, and plankton, as well as other microscopic organisms.
Open data licence: The data on the https://saaristomeri.utu.fi website are licensed under the Creative Commons Attribution 4.0 International license (CC BY 4.0). To cite this data, please use the following format: ‘Seili Environmental Monitoring Programme, Odas Profiling Buoy Datasets. YEAR. Turku University/ Turku University of Applied Sciences, Turku. https://saaristomeri.utu.fi/odas_en/‘.