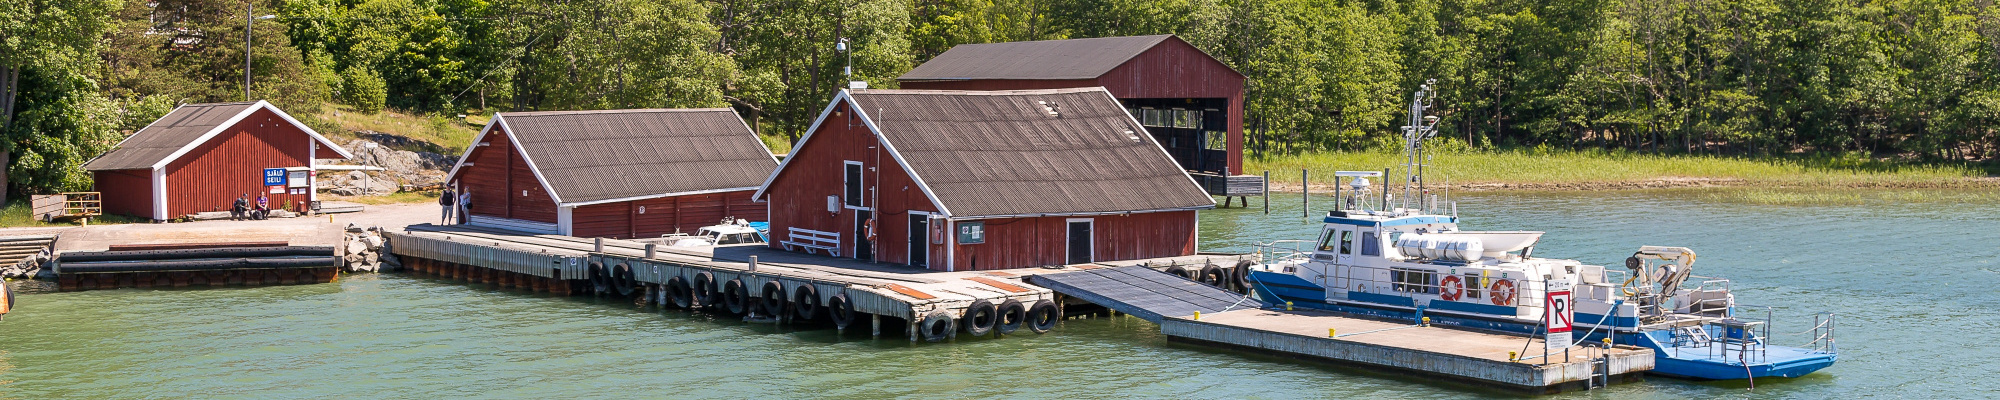

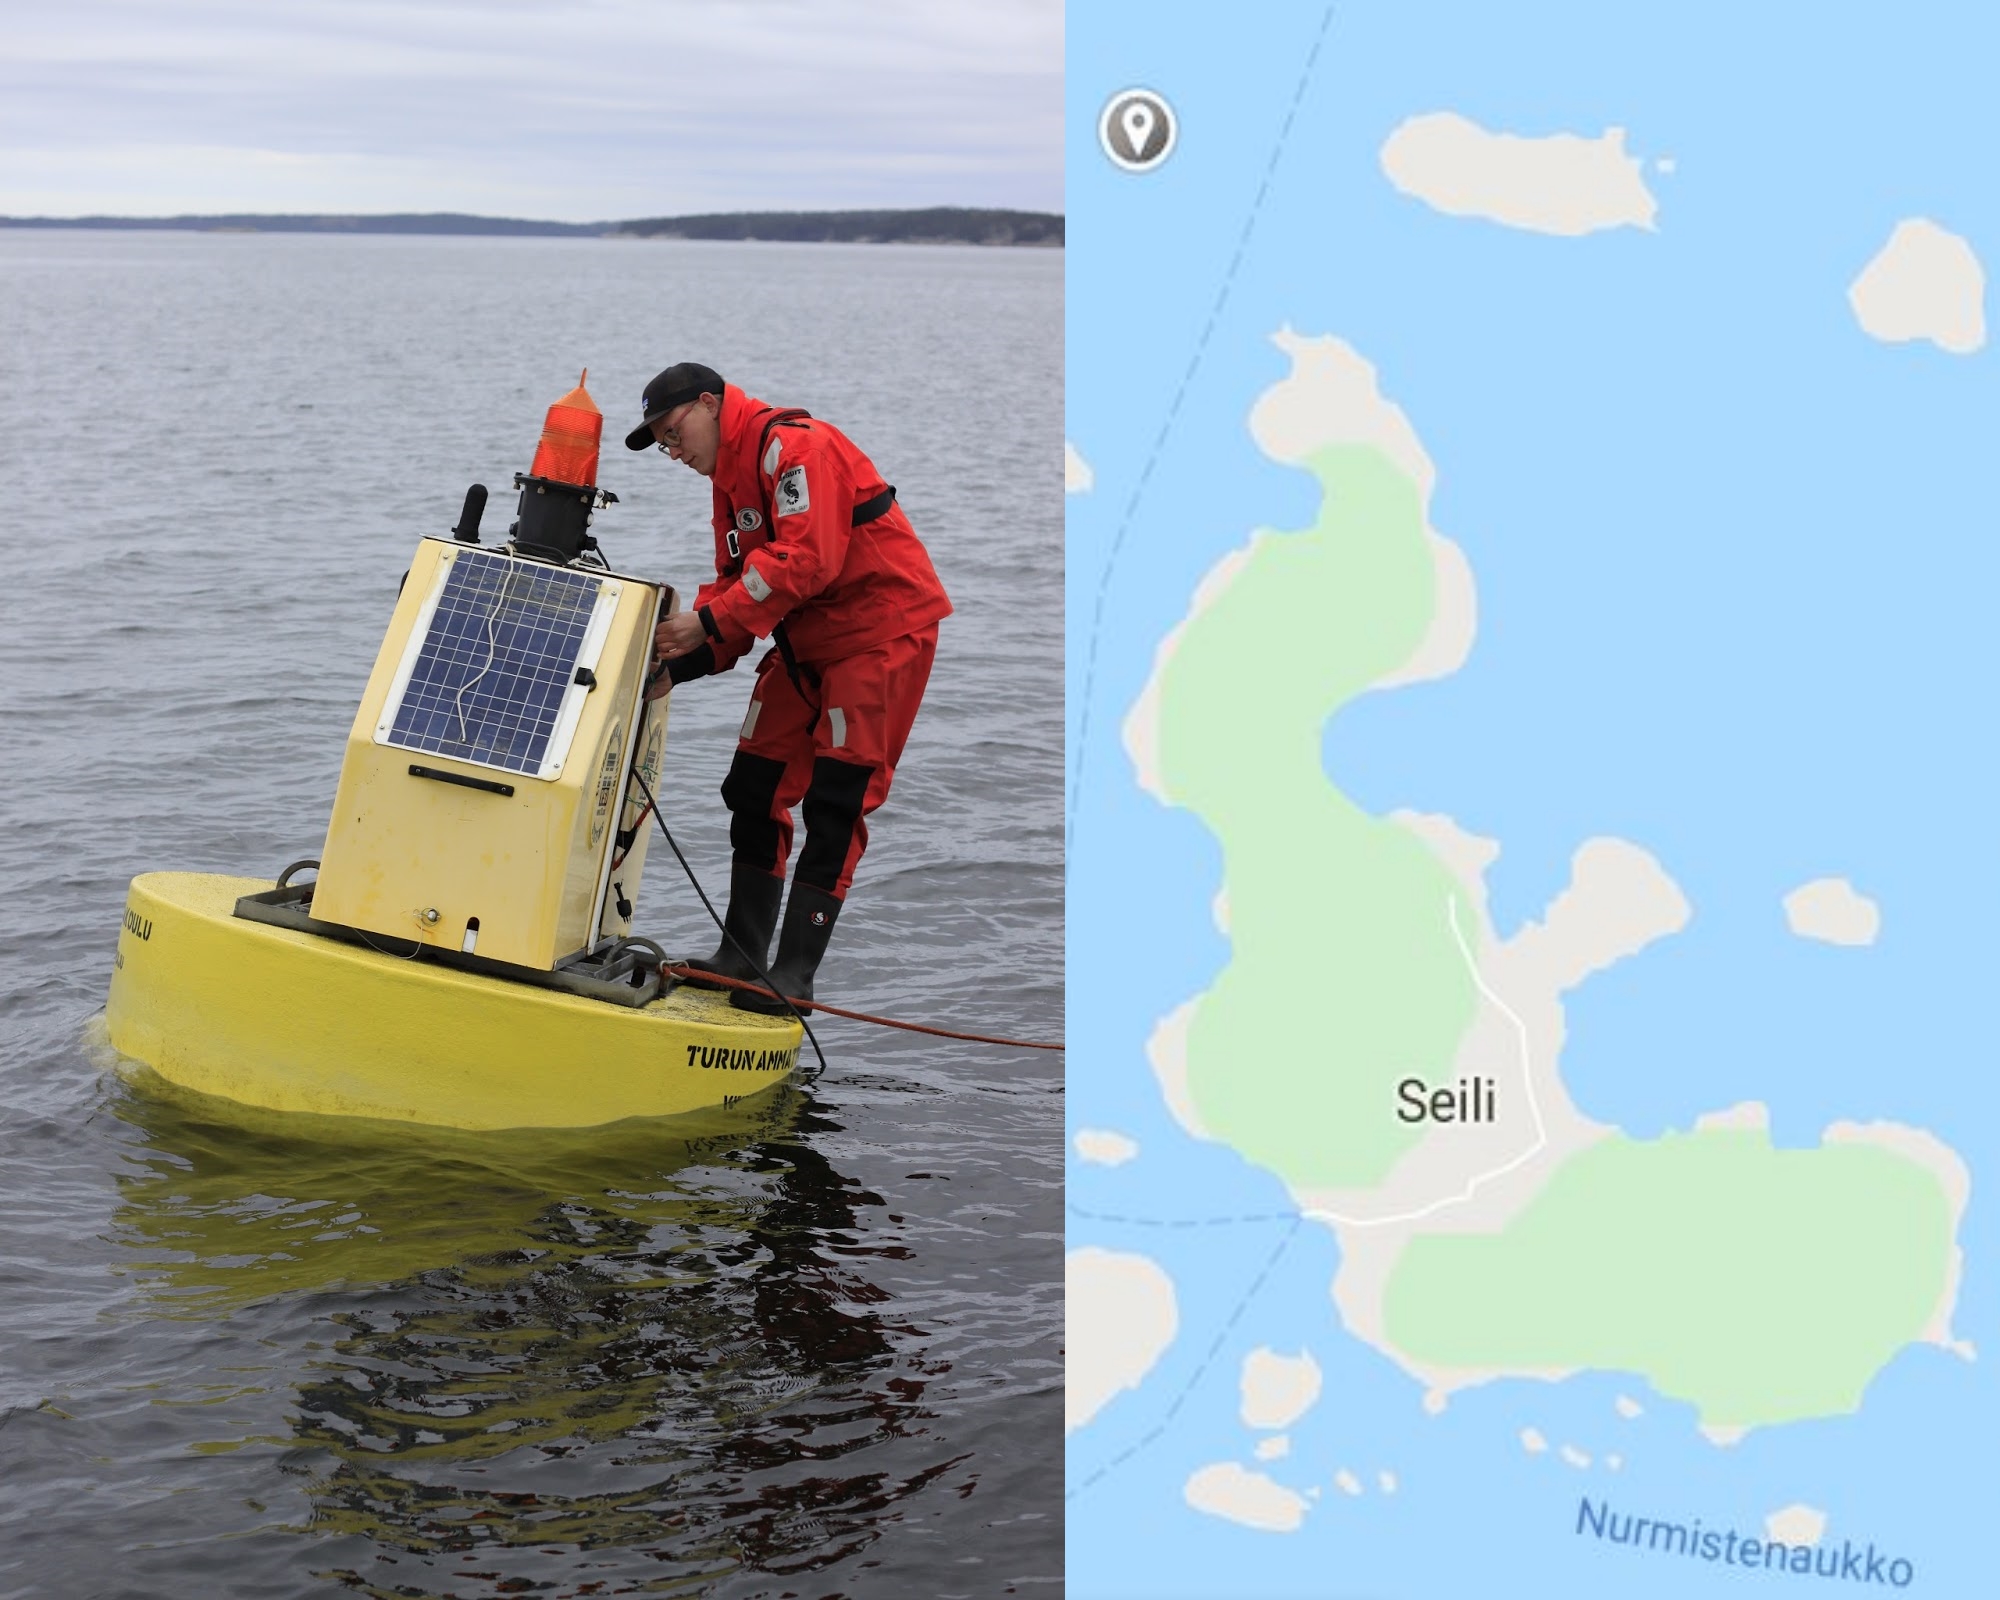
The automated monitoring station north of Seili Island in the Archipelago Sea collects data on water quality, vertical stratification and how these change during the open-water season. The station has been operating since 2006, and data from summer 2011 onward are shown on this page.
The buoy-based monitoring station (YSI 6952/YSI 6000) measures water temperature, salinity, dissolved oxygen, turbidity, chlorophyll and blue-green algae. Measurements are taken four times a day at one-metre intervals from the surface (2 m) to near the bottom (about 45 m). The station operates from spring ice-out until the sea freezes in winter, so there are no winter data. There are no data for 2022–2023 because the buoy was being renewed. The current buoy was put into operation in spring 2024.
The graphs can be scaled, zoomed and saved, and the data can be downloaded as a CSV file using the icons next to the graphs. The graphs were produced by University of Turku, Research IT.
Notes on the data
The data are raw, unprocessed measurements, and their quality has not been checked. The data contain gaps and likely erroneous values, which should be taken into account when using them. The graphs for 2024 are distorted at the start of the season due to buoy installation and calibration. Since the buoy renewal, blue-green algae and chlorophyll values are not directly comparable with those of earlier years.
Licence and citation
The data on the Saaristomeri.utu.fi website are licensed under Creative Commons Attribution 4.0. The licensed data may be used freely, provided the source is cited as follows: Seili Environmental monitoring programme, Odas profiling buoy datasets. YEAR. University of Turku / Turku University of Applied Sciences, Turku. https://saaristomeri.utu.fi/odas_en/
The monitoring is carried out by Turku University of Applied Sciences in cooperation with the Archipelago Research Institute of the University of Turku, the Finnish Meteorological Institute and other FINMARI partners. In summer 2015, the Archipelago Research Institute added sensors to the station measuring air temperature, air pressure, humidity, precipitation, and wind speed and direction; these data can be found here.
Note! A failure in the buoy's data transmission occurred on 12 August 2026. The fault is being repaired, and the missing data will be updated where possible once it has been fixed.
Select the year from which the graphs will be displayed.
Temperature [°C]: Seawater temperature from the surface to a depth of about 40 metres. Surface water temperature begins to rise in May, and at the same time a thermal stratification caused by density differences begins to form. Stratification is strongest in late summer, when surface water temperature can exceed 20 °C while the layer near the bottom remains at about 6–7 °C. The layer separating the warm surface water from the cold bottom water, where temperature changes rapidly with depth, is called the thermocline. In late autumn, as the surface water cools and with the help of storms, the stratification breaks down and the whole water column mixes at a temperature of about 10 °C.
Salinity [‰]: Seawater salinity in parts per thousand. At the monitoring site, salinity usually varies between about 5.7 and 6.2‰. Saltier water is denser, and salinity increases with depth. Salinity also causes stratification: in the deeper areas of the Baltic Sea there is a permanent salinity boundary layer, the halocline, at a depth of about 60–80 metres. However, in the Archipelago Sea, the halocline is very weak or nonexistent.
Oxygen [mg/L]: Dissolved oxygen concentration in the water column. More oxygen dissolves in cold water than in warm water, so concentrations are highest in spring and decrease as the water warms. Photosynthesis by phytoplankton produces oxygen, which can raise concentrations in the surface water, especially during the spring bloom in April–May and in late summer. In summer the water stratifies by temperature, and oxygen from the surface does not mix into the deeper layers. At the same time, the decomposition of organic matter consumes oxygen, so the oxygen concentration in the layer near the bottom decreases over the summer and is lowest in early autumn. In autumn, as the water cools, the water column mixes and the water near the bottom receives oxygen again.
Chlorophyll-a [ug/L]: Concentration of chlorophyll-a in seawater (micrograms per litre). Chlorophyll is the photosynthetic pigment of algae, and its concentration indicates the amount of microscopic phytoplankton. Phytoplankton need light for photosynthesis, which is why they are most abundant near the surface. The highest concentrations are measured in spring after ice-out, during the spring bloom. Concentrations can rise again in late summer and early autumn. Note! The spring bloom only appears in the graphs for years when the buoy was deployed in April. The measuring equipment was also renewed in 2022–2023. From 2024 onward, chlorophyll values in deep water are lower than before. This is most likely due to the change in equipment and its calibration, not a real change in the sea. Surface water values are at the same level in both periods.
BGA [cells/mL]: Blue-green algae (cyanobacteria) in seawater. The instrument estimates the amount of phycocyanin, a pigment characteristic of blue-green algae, using fluorescence. Like other phytoplankton, blue-green algae need light for photosynthesis, so they are most abundant in the surface water. The amount of blue-green algae is usually highest in late summer, when surface concentrations can become very high, especially in calm, warm weather. Note! The instrument and the unit of measurement changed when the buoy was renewed. Results for 2011–2021 are given in cells/mL, and from 2024 onward in [RFU / µg/L]. The values from the two periods are therefore not directly comparable, but seasonal variation and depth distribution can be compared.
Turbidity [NTU]: Water turbidity at different depths. Turbidity indicates how many light-scattering particles the water contains, such as clay and other suspended solids, as well as phytoplankton. The higher the value, the more turbid the water. Turbidity is increased by, among other things, suspended solids carried from land by rivers, bottom sediment mixing into the water, and phytoplankton blooms. Turbidity is typically fairly even in the surface layer and increases near the bottom, where material released from the seabed makes the water more turbid. Water near the bottom is most turbid in late summer. Note! Individual very high values, such as those in spring and November 2019, are probably caused by sensor fouling rather than real turbidity.